How to Read Lighthouse Scores & Page Speed Tests
Every claim an agency makes about “fast websites” can be verified in ninety seconds with a free Google tool. This guide shows you exactly how: what every score means, what good looks like, our own measured numbers — ambers included — and the one test to run on any marketing company before you sign.
The rule this whole page builds to: no agency will build you a better website than the one they built for themselves. Check their scores before you move forward.
What is a good Lighthouse score?
Direct answer: Lighthouse grades every category 0–100. 90+ is good, 50–89 needs improvement, under 50 is poor. But a single lab score is not the verdict — a healthy site passes all three Core Web Vitals in field data (the top section of a PageSpeed Insights report, measured from real users) with lab scores of 90+ across Accessibility, Best Practices, and SEO, and a mobile performance score it can explain.
Thresholds are Google's, from the Lighthouse scoring documentation. The color bands are the same ones you'll see on every report on this page.
Field data decides. Lab data explains.
A PageSpeed Insights report is two different tests stacked on one page, and almost everyone — including plenty of agencies — reads them as one.
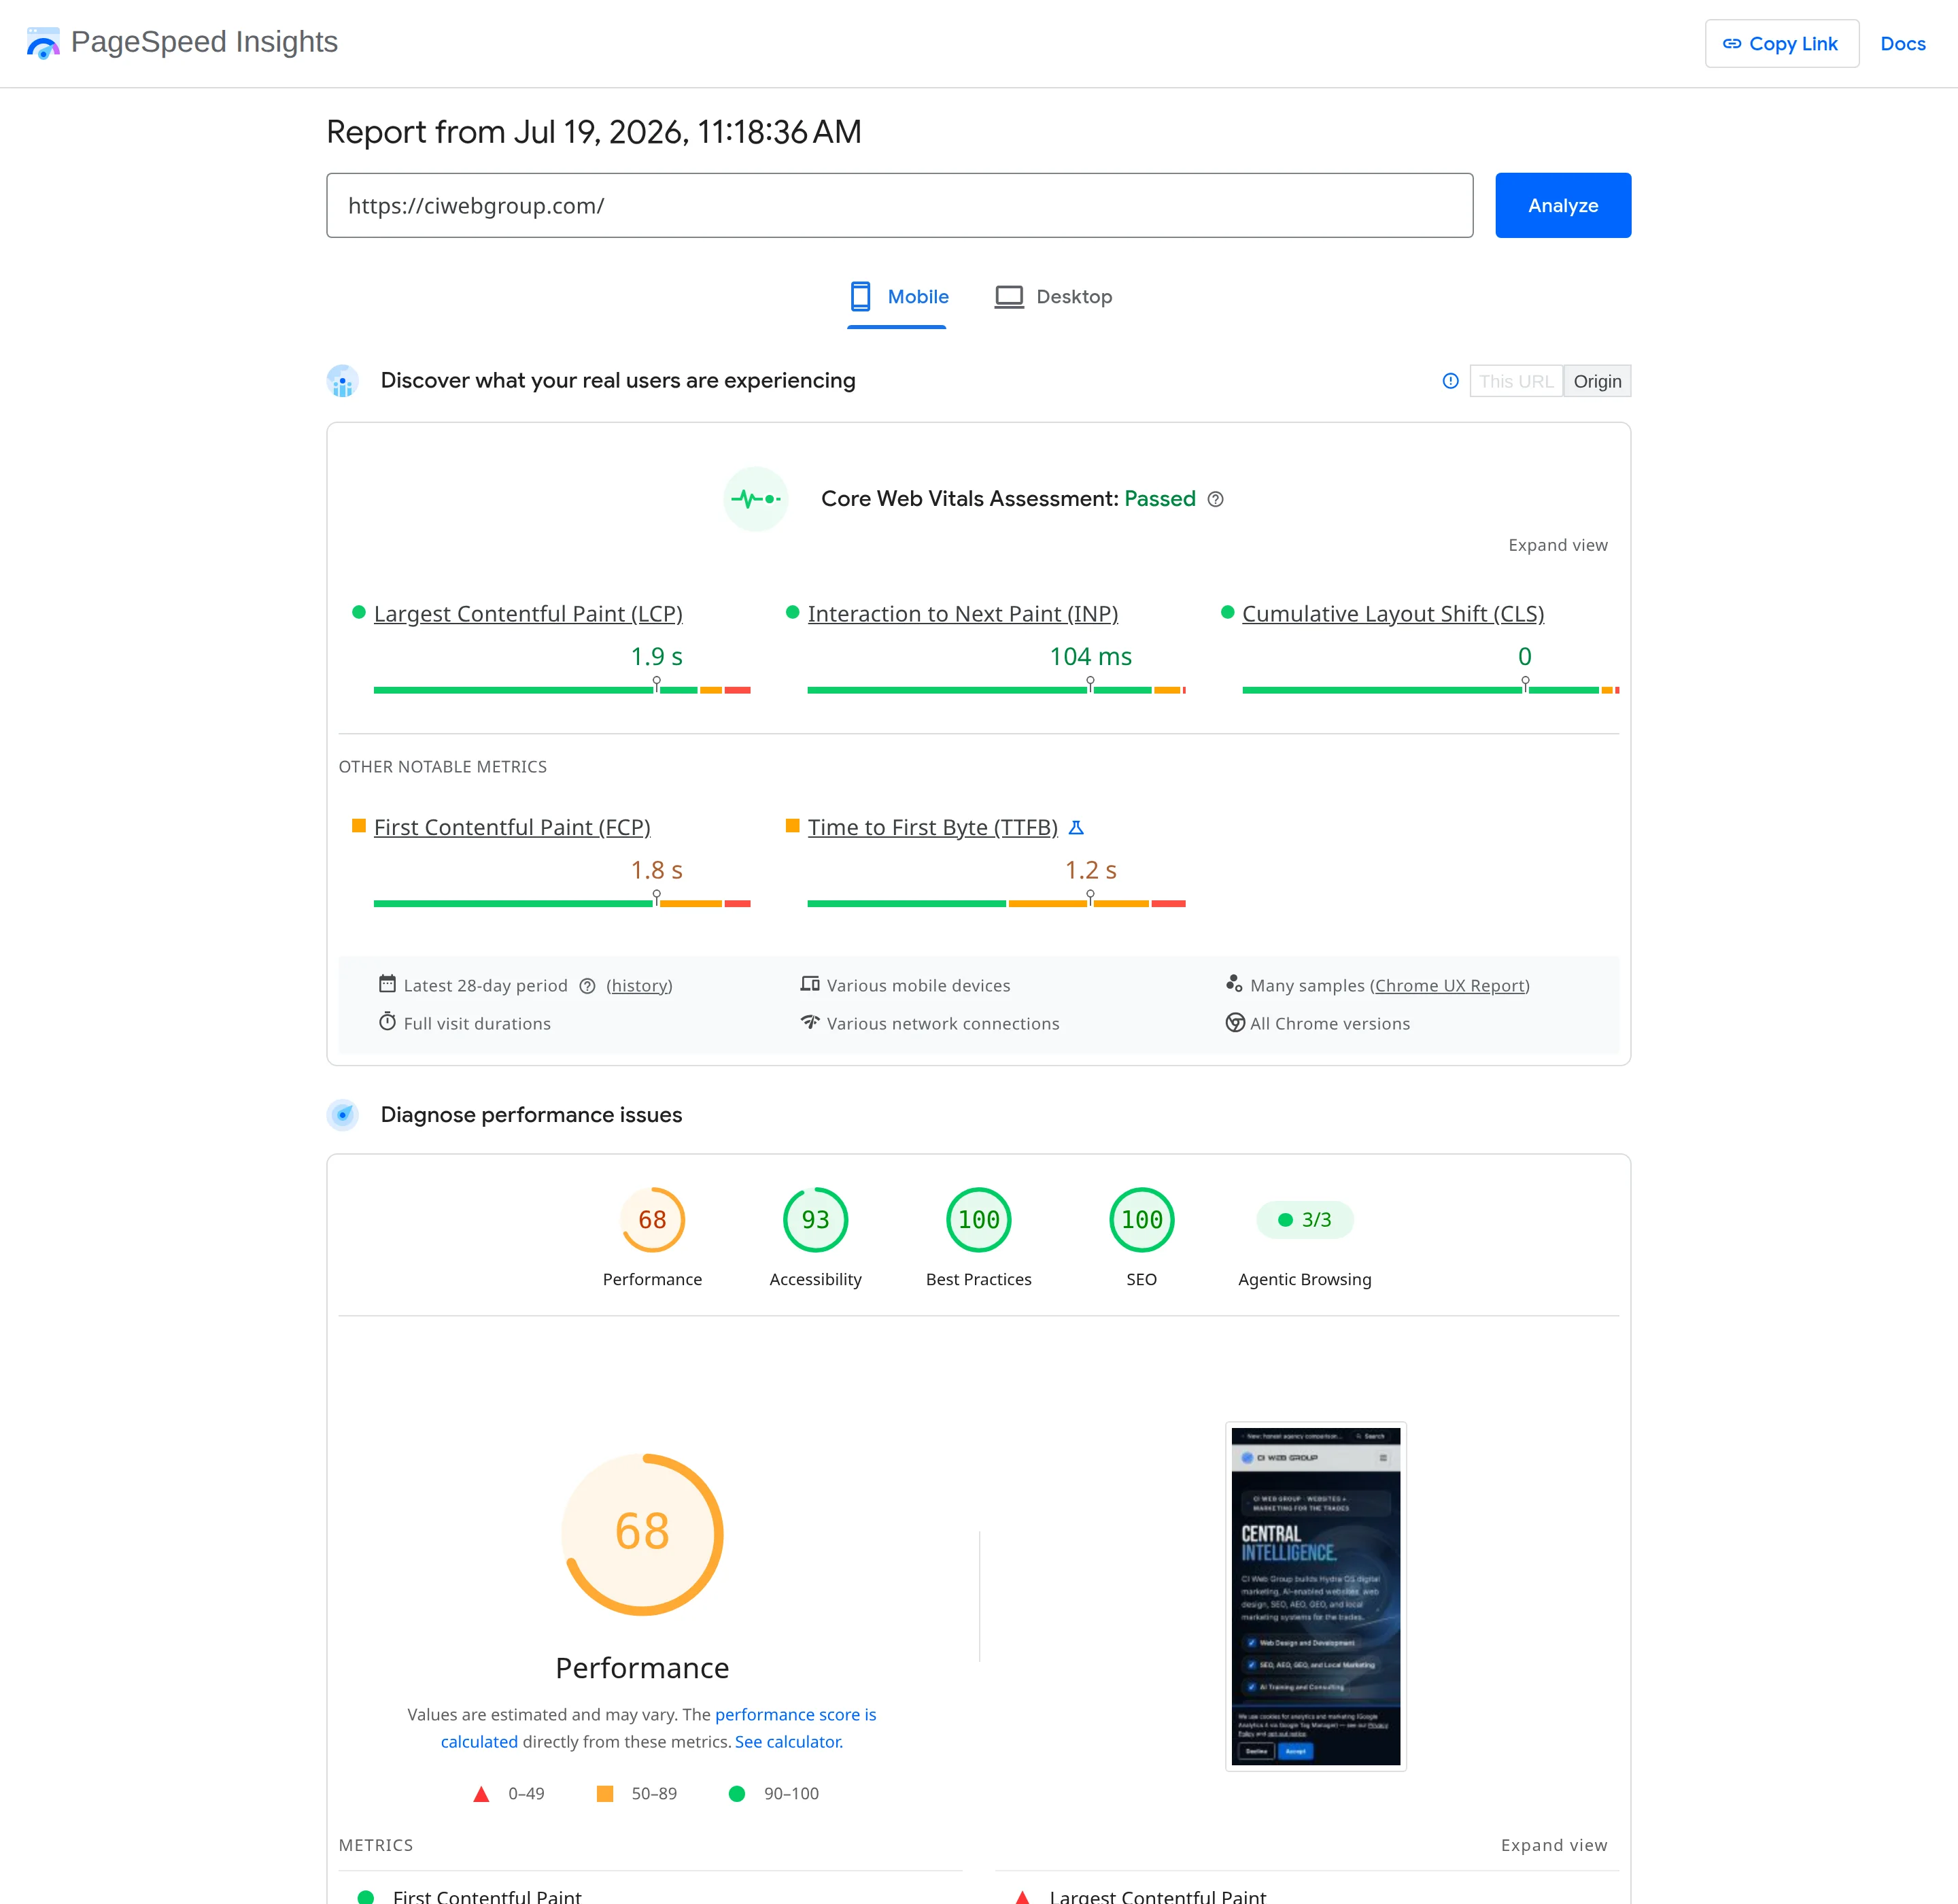
“Discover what your real users are experiencing.” Measured from actual Chrome users over the last 28 days (the Chrome UX Report) — every phone, every network, every cache state your real customers had. This is the data Google's ranking systems use. This section is the verdict.
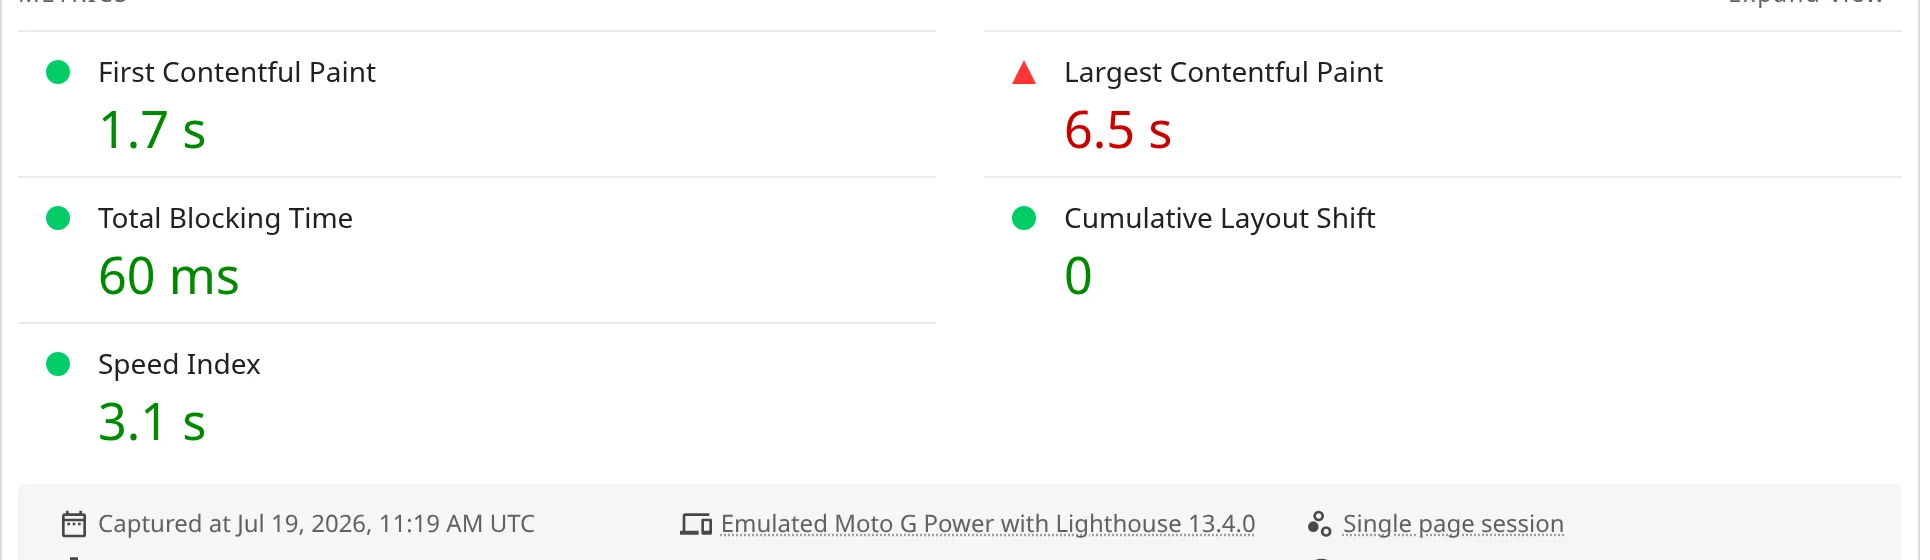
“Diagnose performance issues.” One simulated visit on an emulated Moto G over slow 4G with CPU throttling, run from a Google server the moment you click Analyze. Repeatable and detailed — built for engineers to find causes. This section is the diagnosis.
Small or new sites often show “No Data” in the field section — CrUX needs a minimum traffic volume. That's not a failure; it just means you evaluate on lab until real-user data accumulates. It's also why lab exists at all: every site gets a lab score on day one.
The four scores — and the new fifth one


Performance (0–100)
A weighted blend of five lab metrics: Total Blocking Time (30%) — how long JavaScript locks up the page; Largest Contentful Paint (25%) — when the main content shows; Cumulative Layout Shift (25%) — how much the page jumps; First Contentful Paint (10%) and Speed Index (10%) — how quickly anything paints. JavaScript weight moves this score more than anything else — which is why the third-party section below matters so much for trades sites.
Accessibility (0–100)
Automated WCAG checks: color contrast, form labels, alt text, heading order, touch-target sizes. Two things to know: it's a legal-exposure signal (ADA demand letters against trades sites are real and rising), and it's a floor, not a ceiling — automated checks catch roughly a third of real accessibility issues. Our ADA & WCAG compliance hub covers the rest.
Best Practices (0–100)
Modern-web hygiene: HTTPS everywhere, no browser console errors, no deprecated APIs, correct image aspect ratios, and — increasingly — no third-party cookies. This is the score that quietly exposes integration debt: booking embeds, chat widgets, and old tracking pixels are the usual reason a trades site sits at 75 instead of 100. A low Best Practices score with a “fine” performance score usually means the problems are one redesign away from becoming visible.
SEO (0–100)
Technical crawlability only: indexable, valid canonical, descriptive titles and meta, legible font sizes, crawlable links. A 100 here means Google can read the site — not that it ranks. Treat anything under ~95 as a red flag (these checks are table stakes), and treat 100 as an entry ticket, not an achievement. What you rank for is decided by content, authority, and E-E-A-T — see the Modern SEO Guide.
Agentic Browsing (the new one)
PageSpeed Insights now scores whether AI agents can reliably read and act on your site — parseable static content, accessible structure, no render wall. This is Google acknowledging what we've built toward for two years: a growing share of your customers ask ChatGPT, Perplexity, or Google AI before they ever see a search results page. ciwebgroup.com scores 3/3 — visible in both captures above. If a prospective agency's site fails this check, they are not building for where demand is going. More in the AI Search Guides.
Core Web Vitals, in plain language
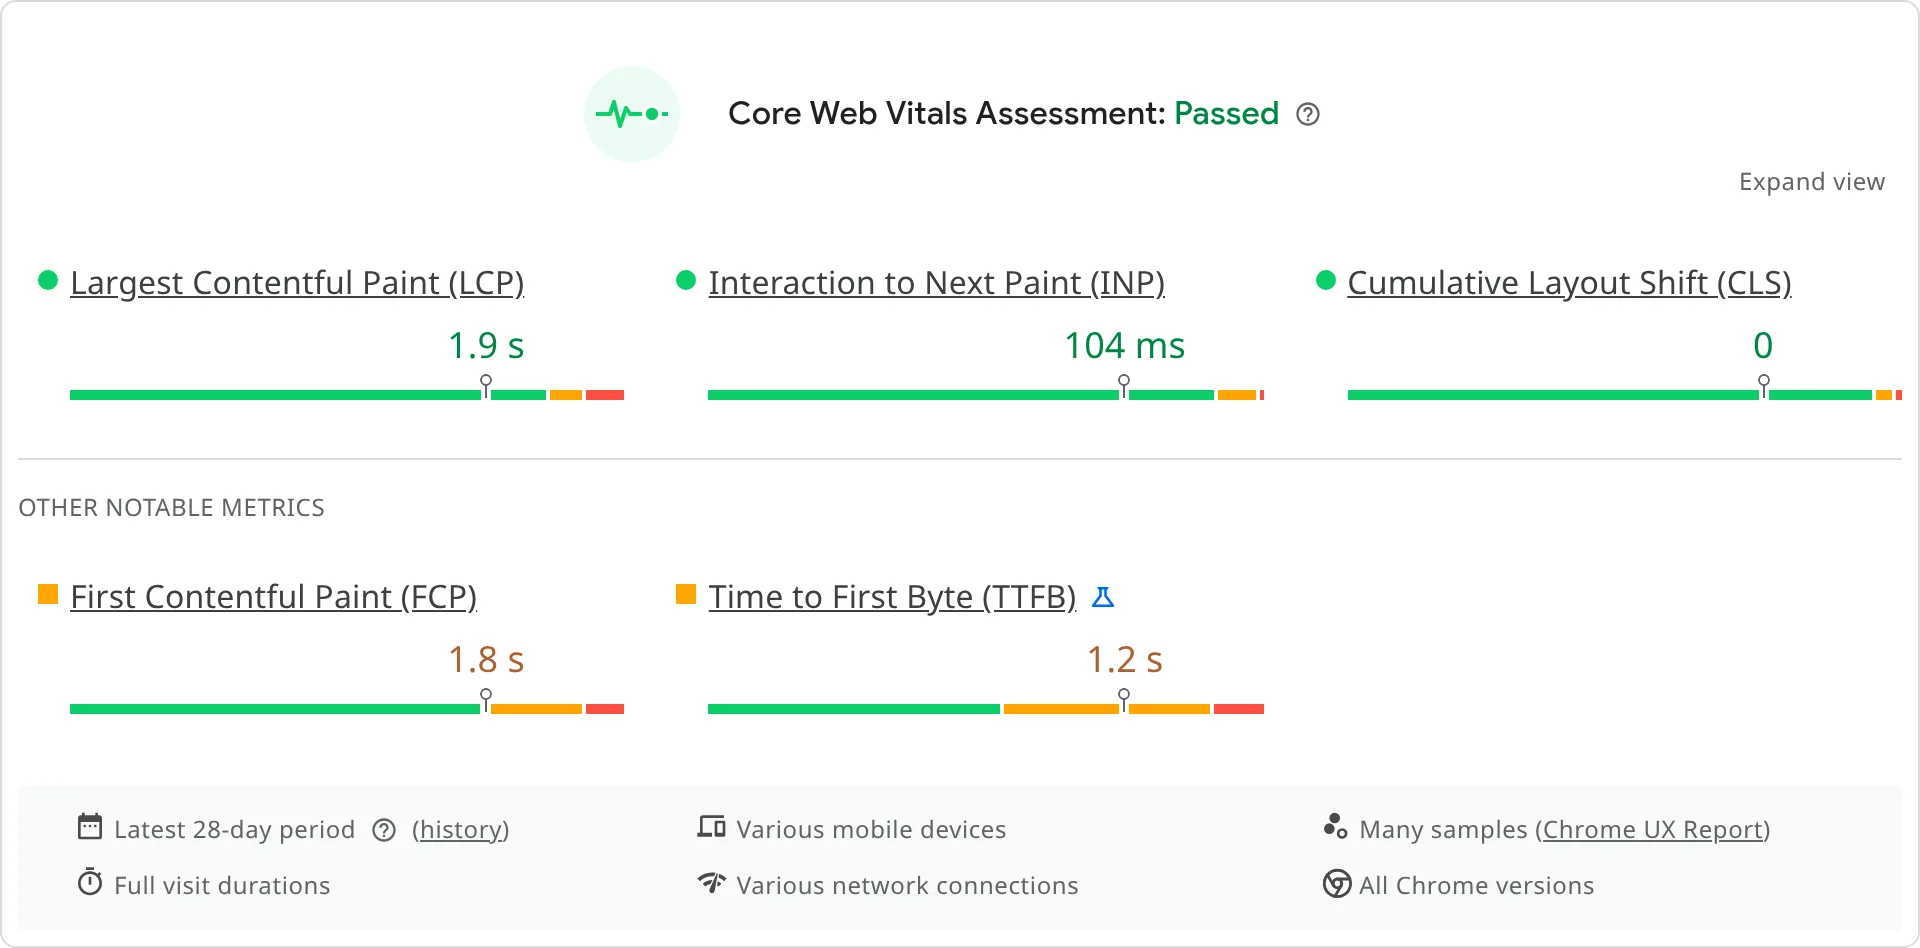
Three numbers, measured from real users, judged at the 75th percentile — meaning three out of four visits must hit the threshold, not the average visit. These are the numbers behind the Passed/Failed verdict at the top of every report.
Largest Contentful Paint (LCP)
How long until the biggest thing on the screen shows up.
What breaks it: Slow servers, unoptimized hero images and videos, render-blocking scripts, client-side rendering that builds the page in the browser after load.
What fixes it: Static HTML that arrives already rendered, properly sized and preloaded hero media, a CDN close to the visitor, and nothing blocking first paint.
Interaction to Next Paint (INP)
How fast the page reacts when someone taps or clicks.
What breaks it: JavaScript hogging the main thread — heavy frameworks, chat widgets, tag managers, and tracking scripts all competing to run while your customer is trying to tap “Schedule Service.”
What fixes it: Shipping less JavaScript, loading third-party tools after the page is interactive, and breaking long tasks apart so the browser can respond to the tap first.
Cumulative Layout Shift (CLS)
How much the page jumps around while loading.
What breaks it: Images without reserved dimensions, late-loading banners and cookie bars, web fonts swapping in at a different size, embeds that pop into the layout.
What fixes it: Reserved space for every image, embed, and ad slot; fonts loaded with fallbacks that match; banners that overlay instead of push.
Why these scores show up in revenue
Search rankings (SEO)
Core Web Vitals are part of Google's page-experience signals — a real ranking input, and in competitive local markets the tiebreaker between two businesses with similar authority. Speed also controls crawl efficiency: fast, static pages let Googlebot fetch more of your site per visit, which matters when your service area needs hundreds of city and service pages indexed.
AI agents & AI search (AXO / GEO)
ChatGPT, Perplexity, Gemini, and Google's AI Overviews fetch pages with tight time and compute budgets. A site that needs seconds of JavaScript execution before content exists is a site an agent may read as empty — or skip. Static HTML with fast time-to-first-byte is readable by every engine on the first request. PageSpeed Insights now scores this directly: the “Agentic Browsing” check. ciwebgroup.com scores 3/3.
Consumers (UX)
Google's own research: as mobile load time goes from 1s to 3s, the probability of a bounce rises 32% — and the majority of mobile visits are abandoned when a page takes longer than 3 seconds. A homeowner with a broken AC at 9pm is the least patient visitor on the internet. They don't wait; they hit back and call the next result.
Conversions (CRO)
Deloitte's “Milliseconds Make Millions” study measured a 0.1-second speed improvement lifting retail conversions 8.4% and travel spend 10.1%. On a trades site, speed is felt at the exact moments money moves: the form that responds instantly, the click-to-call that doesn't stall, the booking widget that's ready when the thumb gets there.
Paid traffic (Ad spend)
Google Ads folds landing-page experience into Quality Score, and Quality Score sets what you pay per click. A slow landing page quietly raises the cost of every single visitor you buy — you pay a speed tax on your whole ad budget, forever.
Infrastructure & resilience
Fast usually means light and static — which also means cheap to serve and hard to crash. A static page survives the traffic spike when a heat wave hits and every AC in town fails the same weekend. A database-backed page builder is most likely to fall over on exactly the day you'd earn the most.
Sources for the external figures: Google/SOASTA mobile speed research (bounce probability +32% from 1s→3s); Deloitte, Milliseconds Make Millions (2020). Our own figures are linked with provenance in the benchmarks below. We measure client outcomes — sessions, calls, booked jobs — on the featured customers stories and the measurement shift page.
Benchmarks — and our averages
Every number in this table is measured, not marketed. “Typical trades site” is the average of the old sites we measured before rebuilding them (published per-story with before/after receipts). “Hydra OS clients” is the average across 24 launches with published Lighthouse mobile scores on /featured-customers — each story names the domain and measurement date.
| Lighthouse (mobile) | Typical trades site — before rebuild* | Hydra OS clients — measured live† | Best published launch |
|---|---|---|---|
| Performance | 59.8 avg | 95.8 avg (22 of 24 at 90+) | 100 |
| Accessibility | 88.8 avg | 96.4 avg | 100 |
| Best Practices | 62.5 avg | 92.9 avg | 100 |
| SEO | 88.5 avg | 98.5 avg | 100 |
*Average of the old WordPress/Wix/Webflow sites measured before their Hydra rebuilds, from the launch stories that publish before/after Lighthouse comparisons. †Average of all 24 featured-customer launches with published Lighthouse (mobile) scores, measured live on production domains, as of Jul 19, 2026. Both datasets are public — every underlying score sits on a story page with the domain and date.
And our own site — shown honestly
ciwebgroup.com on Jul 19, 2026: field Core Web Vitals Passed (LCP 1.9s · INP 104ms · CLS 0), desktop lab 92 · 97 · 96 · 100, mobile lab 68 · 93 · 100 · 100, Agentic Browsing 3/3. The amber mobile lab number is the measured cost of the full analytics, tag, and session-tooling stack we deliberately run on our own marketing site — and the field section shows real users still pass. That's the standard we hold everyone to on this page: publish the number, explain the trade, show the field verdict. When an agency shows you only its best gauge, now you know which questions to ask.
What integrations really do to your scores
Trades websites run on integrations — ServiceTitan scheduling, chat, call tracking, review widgets, tag managers. Every one of them is JavaScript executing on your customer's phone before or during first paint, and each shows up in two places: Performance (main-thread blocking → TBT and INP) and Best Practices (third-party cookies, console errors, deprecated APIs from older embed code).
| Integration | What it loads | Scores it hits | Typical cost when loaded eagerly |
|---|---|---|---|
| ServiceTitan Scheduler embed | Iframe + JavaScript bundle for live booking | Performance (TBT, LCP) · Best Practices | Loaded eagerly on first paint: commonly 5–15 lab performance points on mobile, plus third-party cookie and console-noise flags under Best Practices. |
| Chat widgets (Podium, Intercom, Drift…) | 300–800KB of JavaScript, usually loaded immediately | Performance (TBT, INP) · Best Practices | Commonly 5–20 lab performance points on mobile when loaded eagerly — often the single heaviest third-party on a trades site. |
| Call tracking (CallRail, WhatConverts…) | Number-swap script that runs before content settles | Performance (small) · CLS if numbers reflow | A few points when loaded synchronously in the head; near zero when deferred correctly. |
| Google Tag Manager container | Every tag inside runs on your customer's phone | Performance (TBT, INP) | Scales with tag count. A lean container costs a few points; a 30-tag container built up over five years of vendors can cost 15–25. |
| Review / badge widgets, heatmaps, session recorders | Third-party iframes and recording scripts | Performance · Best Practices · CLS | 2–10 points each; recorders also add third-party cookies that Best Practices flags. |
Ranges are what we observe in lab runs across trades sites we audit and rebuild; the exact cost depends on how and when each script loads, which is the entire point of the next paragraph.
The wrong conclusion
“Rip out the booking widget and chat to get a 100.” A booked job beats a perfect score every single time. ServiceTitan scheduling on your site is worth real revenue; a chat widget that answers at 9pm is worth real revenue. Anyone optimizing scores by deleting revenue tools has confused the scoreboard for the game.
The right conclusion
Load order is everything. The page paints first — static HTML, hero, phone number, form. The integrations load after first paint, on idle or on intent: the scheduler hydrates when the visitor scrolls to it or taps “Book,” chat mounts behind a lightweight button (a facade), tags fire after interactivity. Same tools, same bookings — and the lab cost drops from 20+ points to nearly zero. That's how decoupled Hydra OS builds ship ServiceTitan-integrated sites that still average 95.8.
How to run the test yourself — exact steps
Free, no account, ninety seconds. Do this for your own site today and for any site an agency shows you.
- 1
Open pagespeed.web.dev
That's Google PageSpeed Insights. Paste the full homepage URL (with https://) and click Analyze. It runs from Google's servers, so your Wi-Fi doesn't matter.
- 2
Read the FIELD section first (top)
“Discover what your real users are experiencing.” Look for the verdict: Core Web Vitals Assessment: Passed or Failed. If it says No Data, the site is too small for real-user data — skip to the lab gauges.
- 3
Stay on the Mobile tab
PSI defaults to mobile — keep it there. That's where your customers are and where Google indexes first. Check Desktop after, and be suspicious of anyone who quotes only desktop.
- 4
Read the LAB gauges second (bottom)
Performance, Accessibility, Best Practices, SEO — plus the newer Agentic Browsing check. 90+ green is good. Click any gauge to see the exact failing audits with the elements named.
- 5
Run it three times, take the median
Lab runs vary ±5–8 points naturally. One run is an anecdote; the median of three is a measurement. Field data has no such problem — it's already a 28-day window.
- 6
Test the money pages, not just the homepage
Run your top service page, a city page, and the contact/booking page. Homepages get all the optimization love; the pages that actually convert visitors are where slow sites hide their problems.
- 7
Optional: the DevTools method
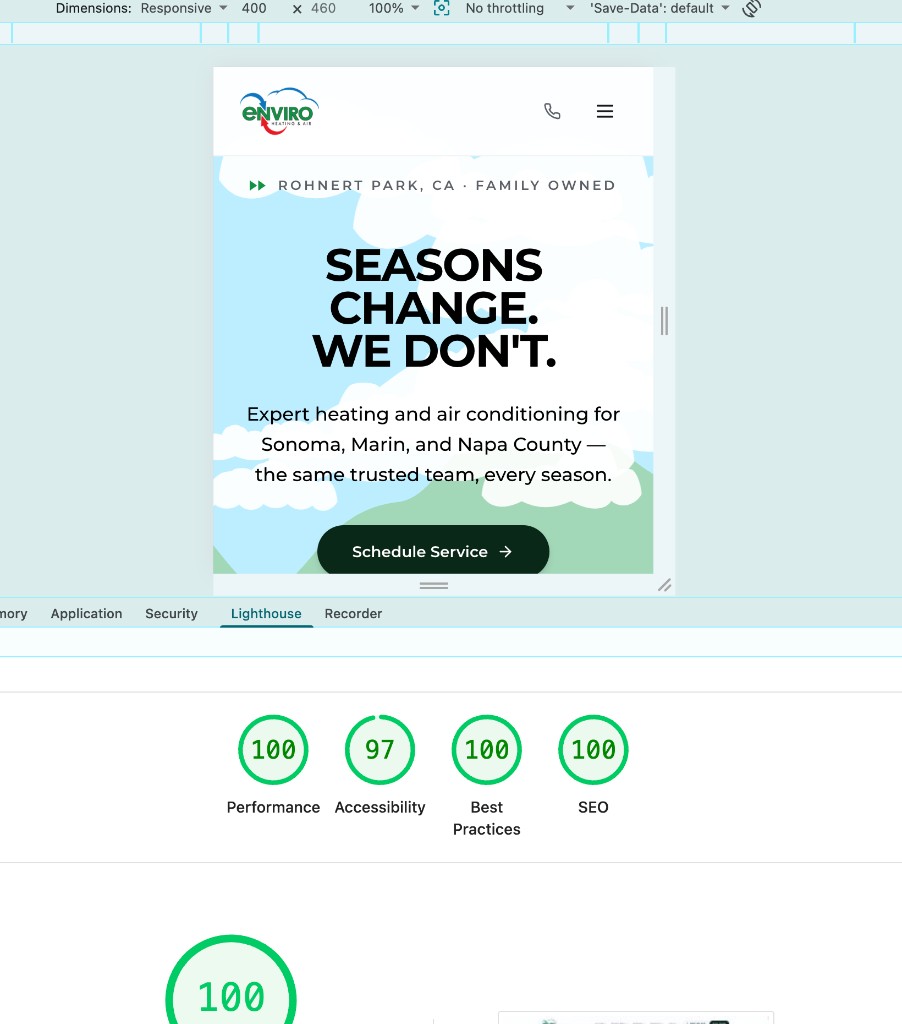
In Chrome: open an Incognito window (extensions off), press F12, open the “Lighthouse” tab, select Mobile, click “Analyze page load.” Same engine, runs on your machine — this is the report you'll see screenshotted in our launch stories.
- 8
Know what disqualifies
Field CWV Failed on mobile; lab mobile performance under 50; Best Practices under 80 with console errors (integration debt); SEO under 95 (basics broken). Any of these on a site an agency built for themselves is your answer.
Test your marketing company before you hire them
An agency's own website is the one project with no client budget limits, no legacy constraints, and no excuses — it is their best work, by definition. It is not likely a marketing agency will build you a better website than they built for themselves. Five minutes on pagespeed.web.dev tells you more than any sales deck.
- 1
Run their own website first
Paste the agency's own domain into pagespeed.web.dev. Mobile tab. If the field section says “Passed,” they practice what they sell. If it fails — or the lab score is deep in the red — you're looking at the ceiling of what they'll build for you.
- 2
Run 2–3 sites from their portfolio
Every agency publishes client work they're proud of. Test those exact sites. Portfolio pieces are their best case — if their best case fails Core Web Vitals, imagine the sites they don't show off.
- 3
Run the same tests on us
Run ciwebgroup.com and any launch on our featured-customers page — every story links the live production domain and publishes the measured scores. We show the receipts before you ask.
- 4
Compare mobile field data, not desktop lab
Desktop lab is the easiest number to make look good and the least representative of your customers. Your buyers are on phones. Judge everyone — including us — on mobile field data first.
- 5
Ask one question
“Walk me through the PageSpeed report of the last site you launched.” An agency that builds fast sites answers in specifics — LCP element, script budget, what they deferred and why. An agency that doesn't will change the subject to design awards.
We publish side-by-side comparisons with the industry's biggest agencies — with sourced facts, not spin — on the agency comparison pages, and every launch on featured customers links its live domain so you can run these exact tests on our work right now. That's the standard. Hold everyone to it.
Questions owners actually ask
›What is a good Lighthouse score?
90–100 is good, 50–89 needs improvement, 0–49 is poor. But the score to trust first is the field section at the top of a PageSpeed Insights report — real Chrome users over the last 28 days. A site should pass all three Core Web Vitals in field data; lab scores are the engineering diagnostic, not the verdict.
›What's the difference between lab data and field data?
Field data (the top of a PageSpeed Insights report) is measured from real visitors' phones via the Chrome UX Report — it's what Google actually uses for rankings. Lab data (the gauges below) is one simulated run on a throttled mid-range phone over slow 4G — it exists so engineers can diagnose and reproduce issues. Field decides; lab explains.
›Why does my site score lower on mobile than desktop?
The mobile lab run simulates a mid-range Android phone (a Moto G) on a slow 4G connection with 4x CPU throttling. That's intentional — it represents a real customer on a real network, not your office Wi-Fi. Mobile is also the score that matters: Google indexes mobile-first and most local-service traffic is phones.
›Do Core Web Vitals really affect rankings?
Yes — they're part of Google's page-experience ranking signals. Content relevance and authority still dominate, but in local markets where the top competitors have similar content and reviews, page experience is a genuine tiebreaker. Speed also compounds indirectly: lower bounce, deeper crawl, better ad Quality Score.
›Will a ServiceTitan scheduler or chat widget ruin my scores?
Loaded eagerly, yes — booking embeds and chat widgets are routinely worth 5–20 lab performance points each on mobile, and they trip Best Practices flags for third-party cookies and console errors. Loaded correctly — after first paint, or behind a click-to-open facade — the same tools cost almost nothing. You don't have to choose between booked jobs and a fast site; you have to load the tools in the right order.
›Why doesn't a 100 performance score guarantee rankings?
Speed is one signal. A fast site with thin content, no authority, and no reviews still loses to a slower site that actually answers the query. Treat performance as the foundation that lets everything else work — not a substitute for content, E-E-A-T, or local proof.
›How many times should I run the test?
Lab runs vary — ±5–8 points between runs is normal because networks and machines vary. Run it three times and take the median. Field data doesn't have this problem; it's a 28-day rolling window of real users, which is why it's the number to judge on.
›What should I check before hiring a marketing agency?
Test the agency's own website and two or three sites from their portfolio on pagespeed.web.dev, mobile tab, field section first. No agency will build you a better website than the one they built for themselves. If their own house isn't in order, your site will inherit the same architecture, the same plugins, and the same scores.
›What is the Agentic Browsing check in PageSpeed Insights?
A newer PSI check that scores whether AI agents can reliably read and act on your pages — static, parseable content; accessible structure; no client-side rendering wall. It matters because a growing share of buyers ask ChatGPT, Perplexity, or Google AI first. ciwebgroup.com scores 3/3.
›Are these scores something I can check myself, without any tools?
Yes — pagespeed.web.dev is free, requires no account, and runs from Google's servers. Paste a URL and read the report. The DevTools route (F12 → Lighthouse) is also free and runs from your own machine. Anyone who tells you performance is too technical to verify is asking you not to check.
Want us to run the full evaluation for you?
We'll run field and lab diagnostics on your site and your top competitors — Core Web Vitals, integration load-order, agent readability, and the money pages — and send you the findings with the receipts, the same way we publish our own.
- 30-minute Zoom
- No deck, no pitch
- Strategist, not SDR
- Walk the live dashboard
Start right here on ciwebgroup.com.
Booking and contact requests run through our on-site Get Started journey, so every inquiry lands in one place. Pick a time or tell us what you need there.
Book a strategy sessionOne journey · strategy to signed plan at /get-started
Prefer to browse first? See the measured launches, the agency comparisons, or start your build.